Installation
Firefox does not come with Firebug installed by default, you need to install it manually. To do that navigate to this page with Firefox, and click on the +Add to Firefox button.
Introduction
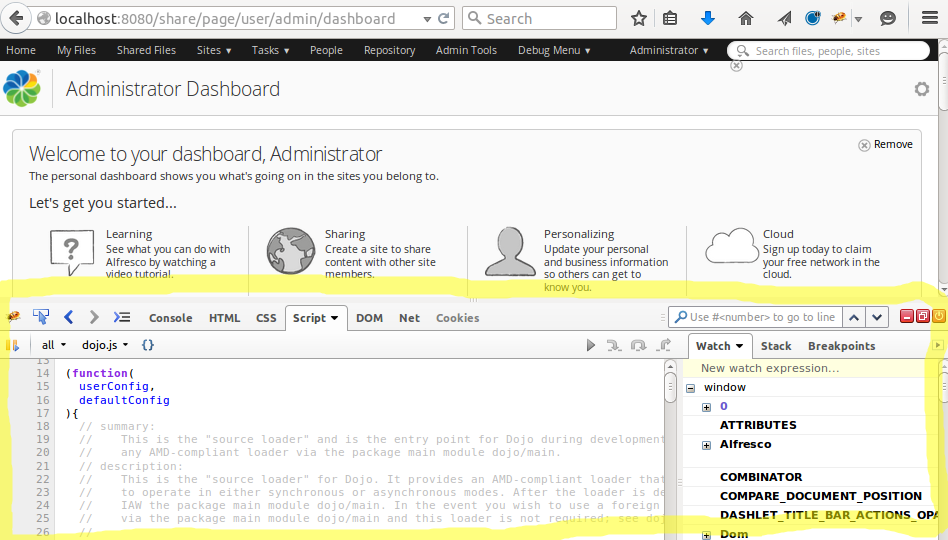
Once the Firebug plug-in has been installed in Firefox we can activate and use it. To activate the plug-in click on the Firebug icon in the Add-ons toolbar in the upper right corner of the browser window. See the following picture:


Finding out what Web Script(s) that is behind a page
One common task during Share extension development is to find out what web script that is used for a specific functionality in the user interface, such as file upload.
Instead of guessing for a while it is better to load the page that contains the functionality we are working with, and then inspect the JavaScript files that are loaded. Often you can deduct what web script that is used by looking at the names of the JavaScript files, as they are often similar to the web script file names.
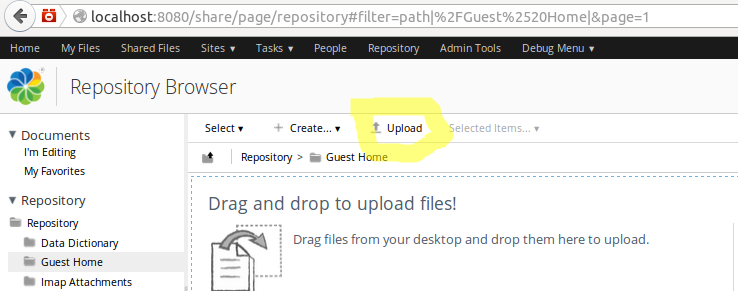
Let's take the file upload as an example, how could we find the web script related to it? Start by navigating to a folder. From the User Dashboard click the Repository menu item in the top level menu. Then click on the Guest Home folder. You should now see the following window:


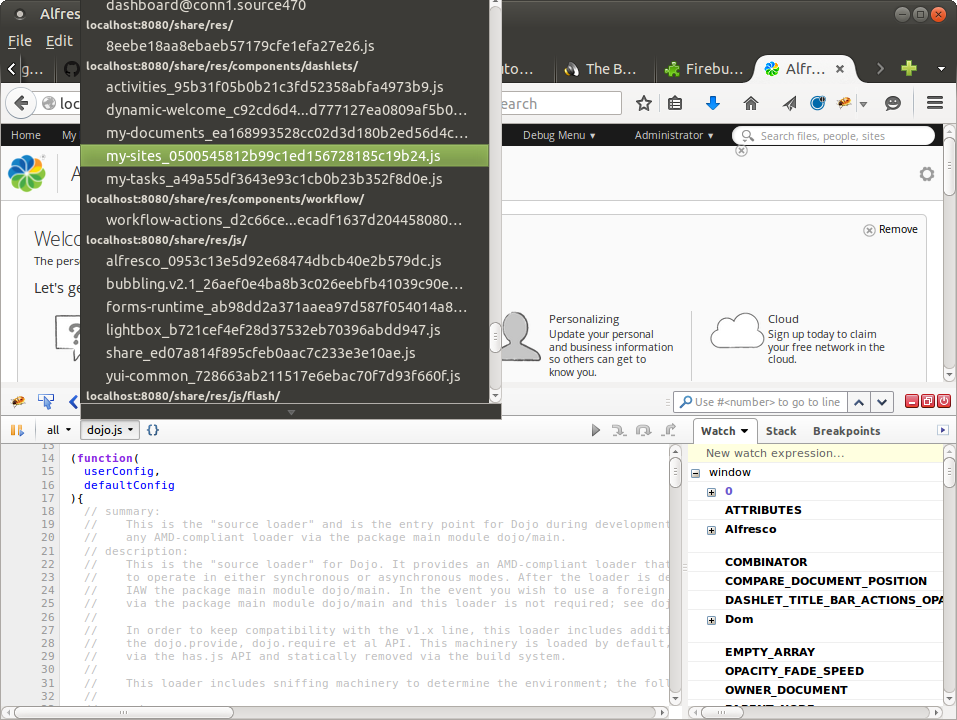
In this case I have scrolled down a bit in the script list until I came across JavaScript files called something related to file upload, such as dnd-upload_xxx.js, file-upload_xxx.js, flash-upload_xxx.js, and html-upload_xxx.js.
martin@gravitonian:/opt/alfresco501/tomcat$ find . -name "flash-upload*.xml"
   ./webapps/share/WEB-INF/classes/alfresco/site-webscripts/org/alfresco/components/upload/flash-upload.get.desc.xml
The thinking here is that most of the functionality is using some client side JavaScript that we can use as entry point when searching. And then we can back track to the related Web Script files. Even better, we can search directly for the JavaScript file name and see if any Web Script file refers to it:
martin@gravitonian:/opt/alfresco501/tomcat$ find . -name "*.ftl"|xargs grep "flash-upload.js"
./webapps/share/WEB-INF/classes/alfresco/site-webscripts/org/alfresco/components/upload/flash-upload.get.html.ftl:   <@script type="text/javascript" src="${url.context}/res/components/upload/flash-upload.js" group="upload"/>
So in this case it is quite clear that the Flash Upload functionality is managed by the flash-upload.get Web Script.
Debugging JavaScript files
Another common task during Share extension development is to be able to debug out-of-the-box and custom JavaScript files.
- Load the web page that refers to the JavaScript file.
- In the script list select the JavaScript file so the source for it is displayed.
- Set breakpoints in the JavaScript code (by clicking to the left of the line number)
- Refresh the web page so the debugger stops at first breakpoint

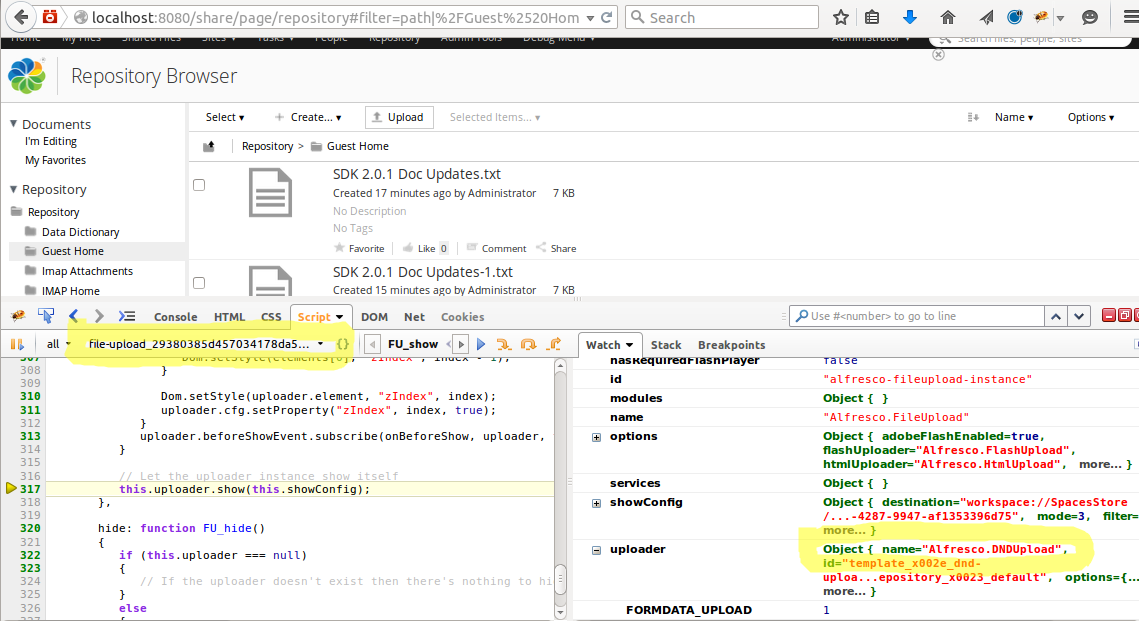
In this case the file-upload.js file with the checksum name was selected from the script list. Then a breakpoint was set in the show: function FU_show(config) method. To start debugging we just needed to click on the Upload button in the toolbar. To step over a line use F10, to step into use F11, and to continue to next breakpoint use F8.
An important thing we can see here is that the actual Uploader component used is the DNDUpload (Drag-and-Drop) component, and not the FlashUpload that we might think. So it is important to debug into the source and see what is really going on.
