It is possible to start an application ready for remote debugging by using
the Maven mvnDebug command.
Eclipse or another development
environment such as IDEA can then connect to the running application for remote
debugging.
You should have an extension project imported, see importing a project into
Eclipse.
It is quite common that you would need to debug Java code associated with a SkyVault extension you are developing.
For example, if you are developing a Java backed Web Script.
The command mvnDebug can be used to start the application in remote
debugging mode, where it will listen on port 8000, ready for a remote debugger to attach.
- In this tutorial we assume that we are working with an All-in-One (AIO) project, change into the top directory (SkyVault-extensions/all-in-one).
Start the AIO project in debug mode.
-
Run mvnDebug rather than the mvn command:
$ mvnDebug clean install -Prun
Preparing to Execute Maven in Debug Mode
Listening for transport dt_socket at address: 8000
...
The Maven project will start and listen for a remote debugger on port 8000.Important: This is usually done outside the IDE.
Connect to the running application process from Eclipse
- In Eclipse, select from the main menu.
- Select Remote Java Application and click the New icon on the top left of the dialog.
- Give the Debug Configuration a suitable name, such as "Debug SkyVault Extension".
- Click Browse and select the repo-amp project, the rest of the fields for host and port have suitable default values.
- Click Apply.
- Click Debug to run the Debug Configuration and connect to the remote SkyVault server.
- In Eclipse, enable the Debug perspective by selecting from the main menu.
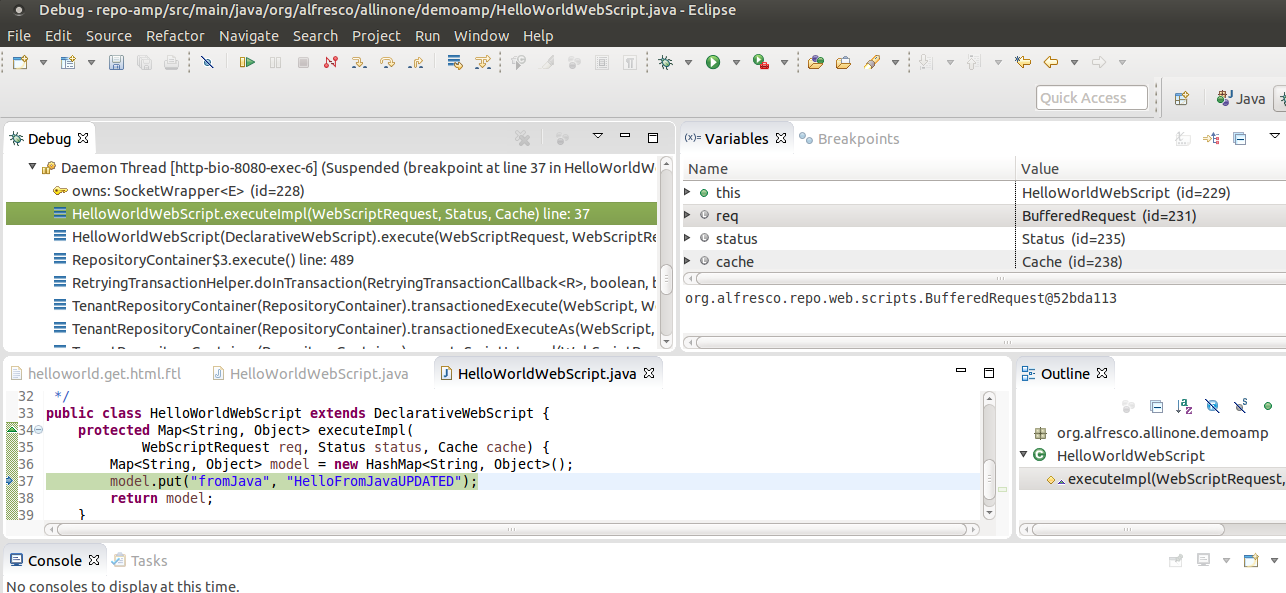
- Set a breakpoint in the all-in-one/repo-amp/src/main/java/org/alfresco/allinone/demoamp/HelloWorldWebScript.java) file.
-
Invoke the http://localhost:8080/alfresco/service/sample/helloworld Repository Web Script from the Browser
You should now see the process stopping in the debugger as follows:

